Using ggplotbattles to support learning data visualisation

Teaching ggplot2 through competitive, browser-based practice

Michael Lydeamore

Department of Econometrics and Business Statistics, Monash University

The teaching problem

Data visualisation is not just syntax.

Students need to connect:

  • data structure
  • ggplot2 grammar
  • graphical judgement
  • debugging and iteration

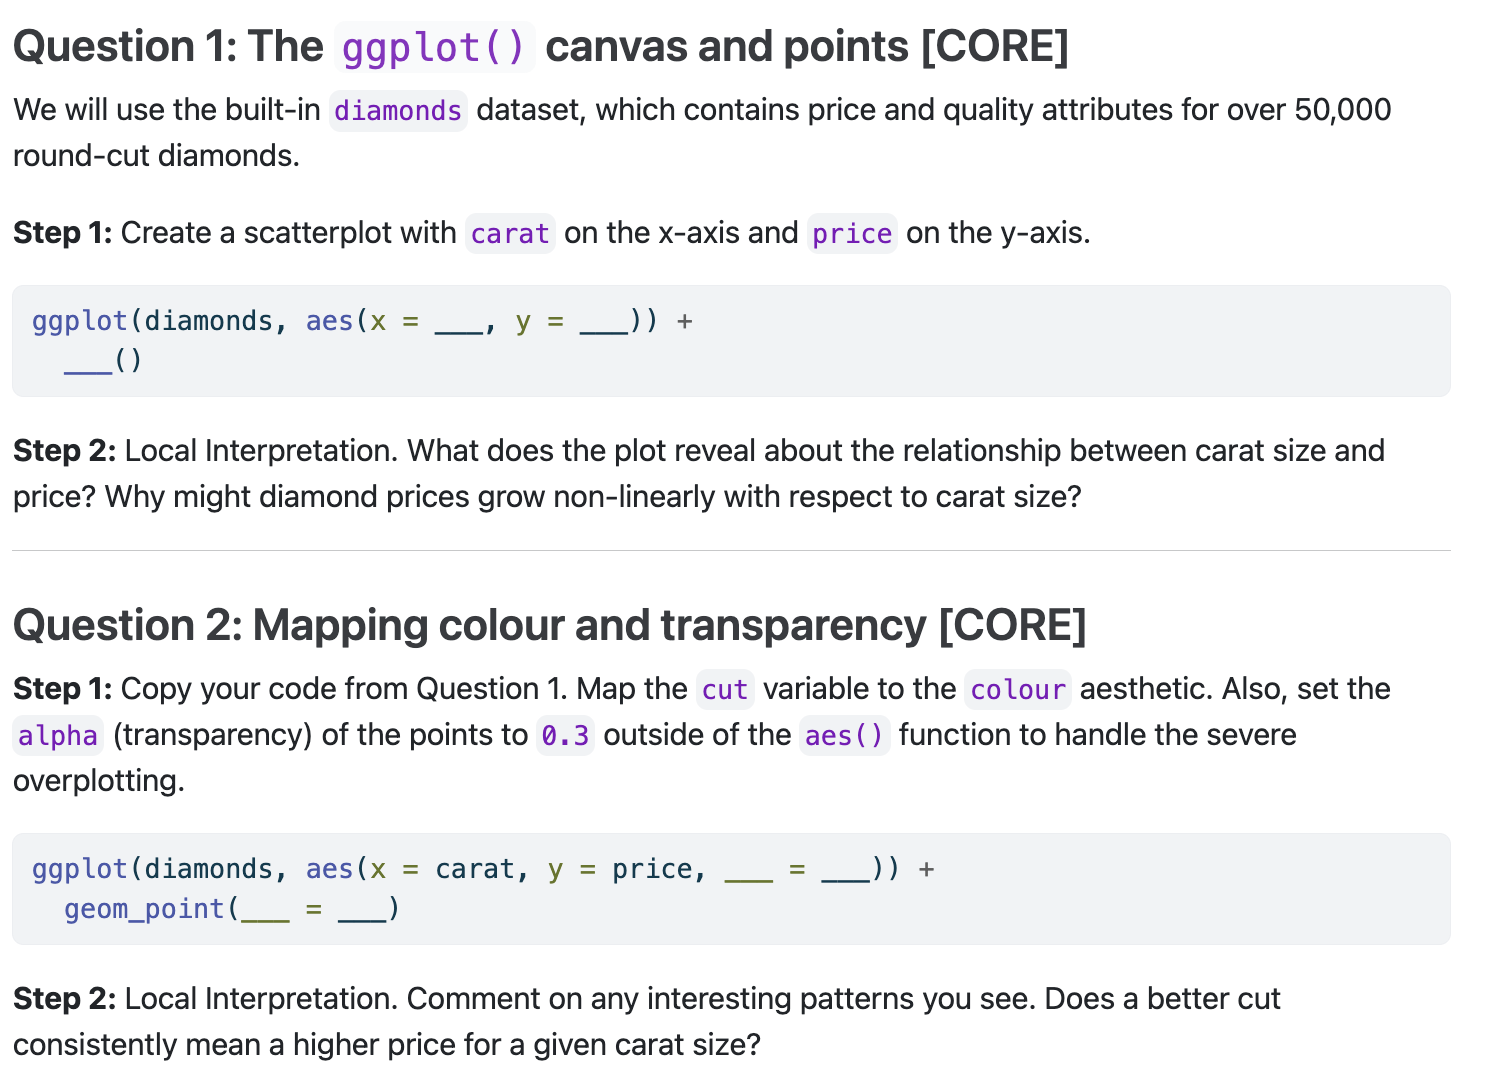
A typical tutorial problem

Students can watch an expert build a plot and still be unsure how to start the next one.


The missing skill is often translation:

target visualisation -> code choices
The design idea

Make the invisible expert loop visible, social, and fast.


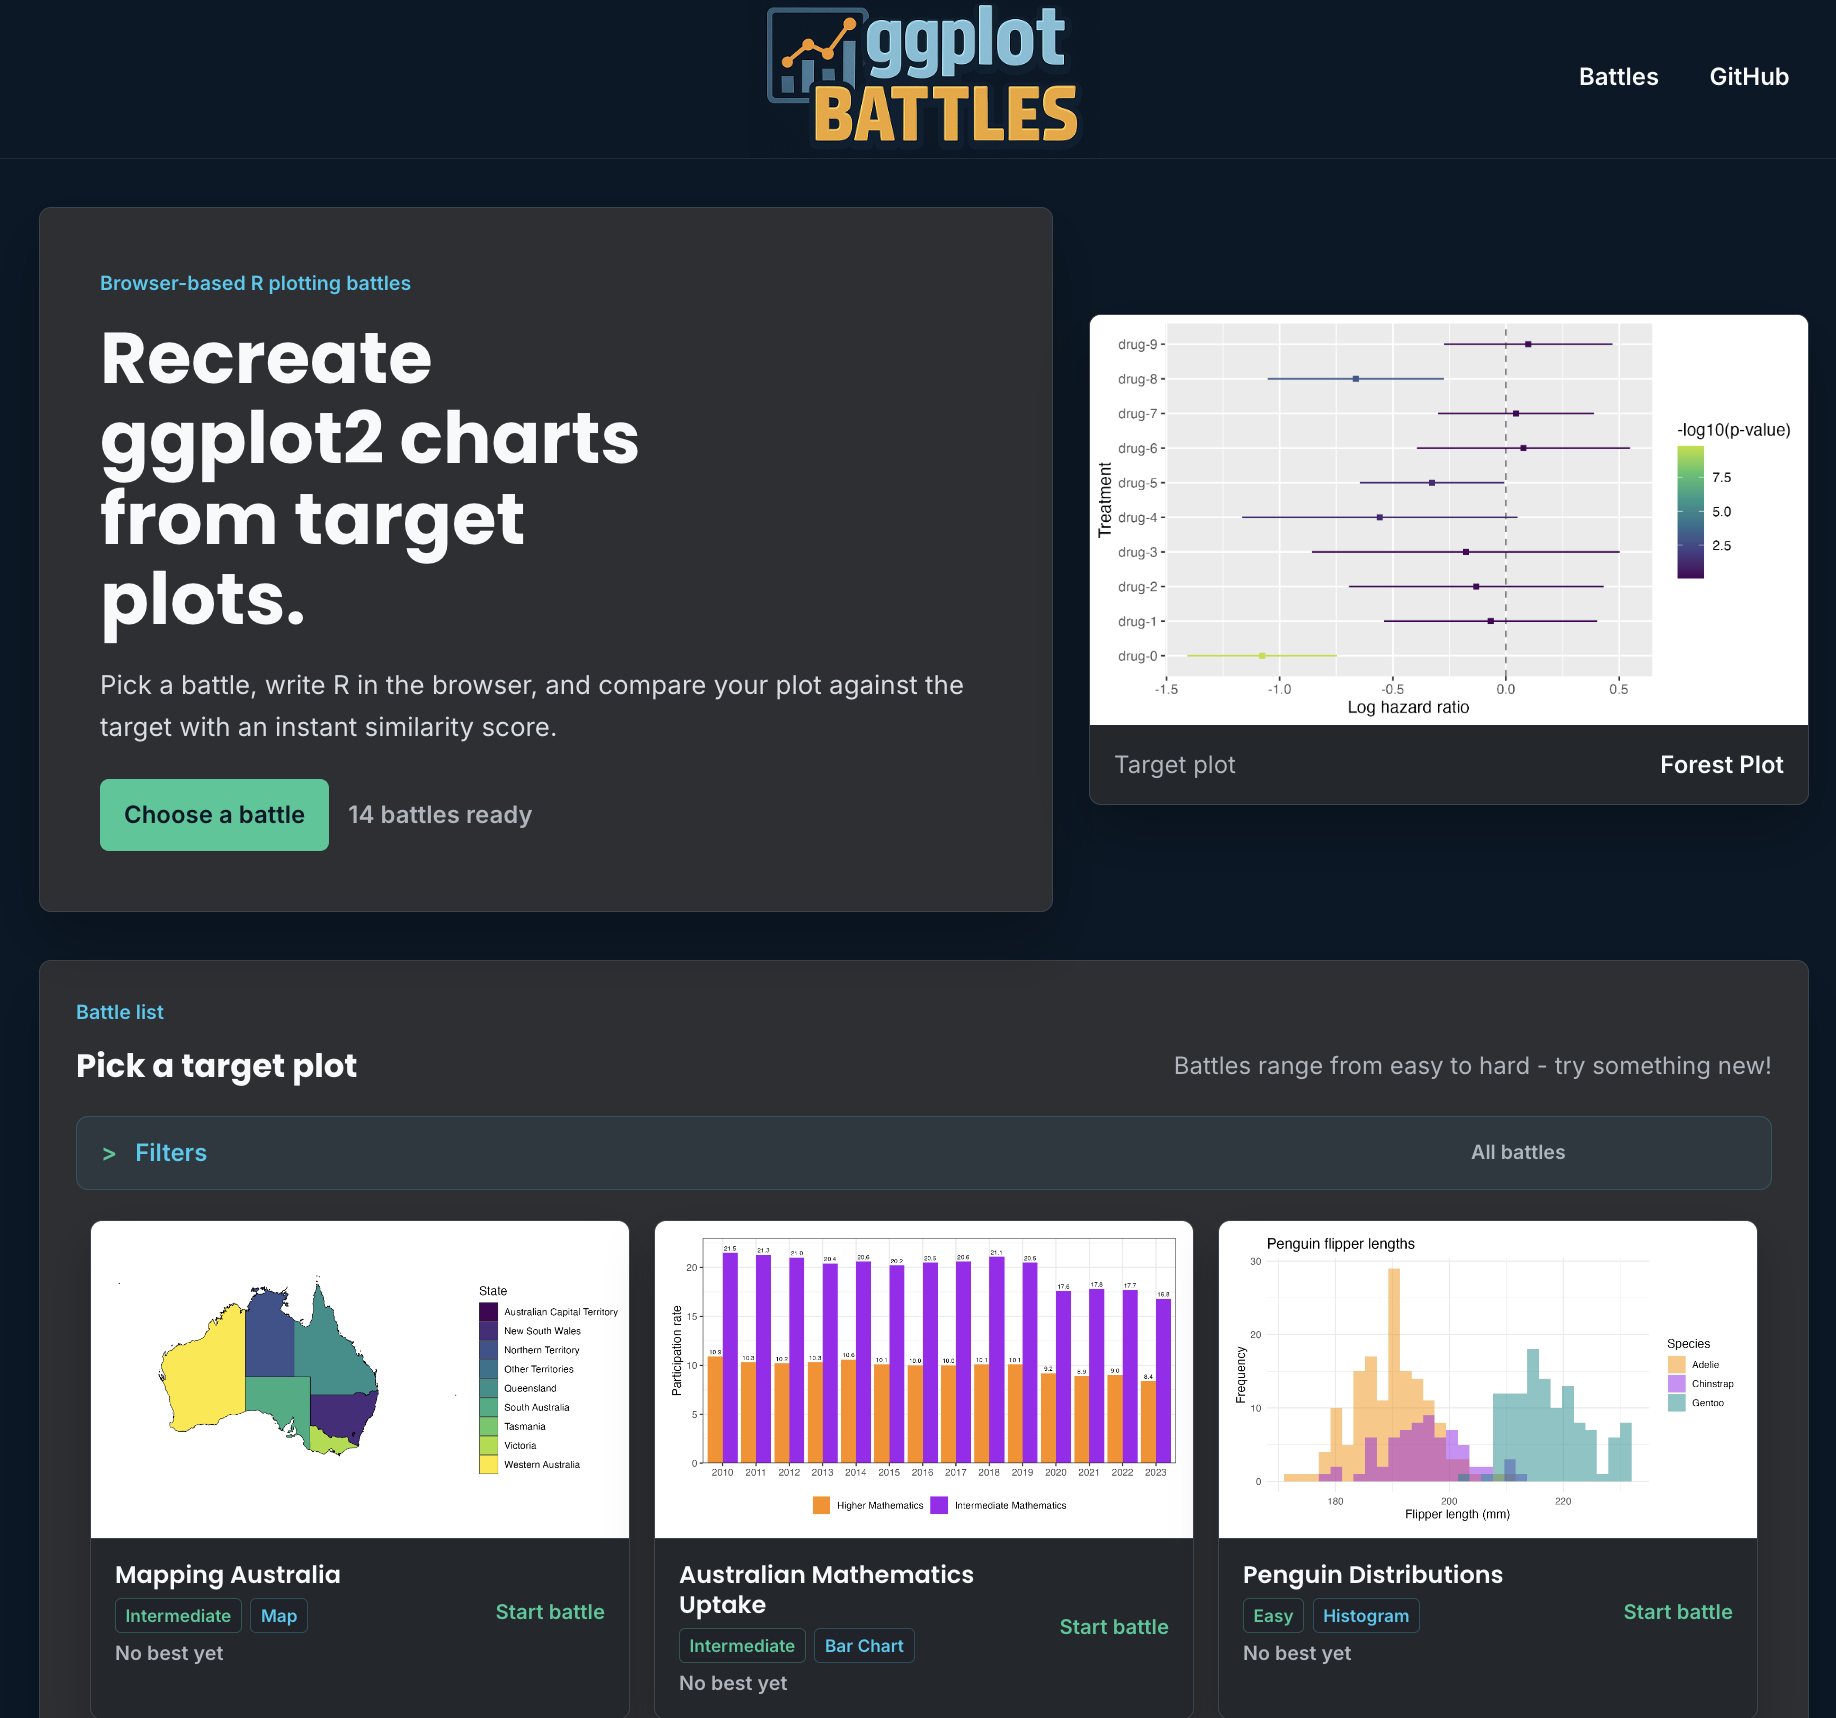
ggplotbattles turns plot recreation into a short competitive activity:

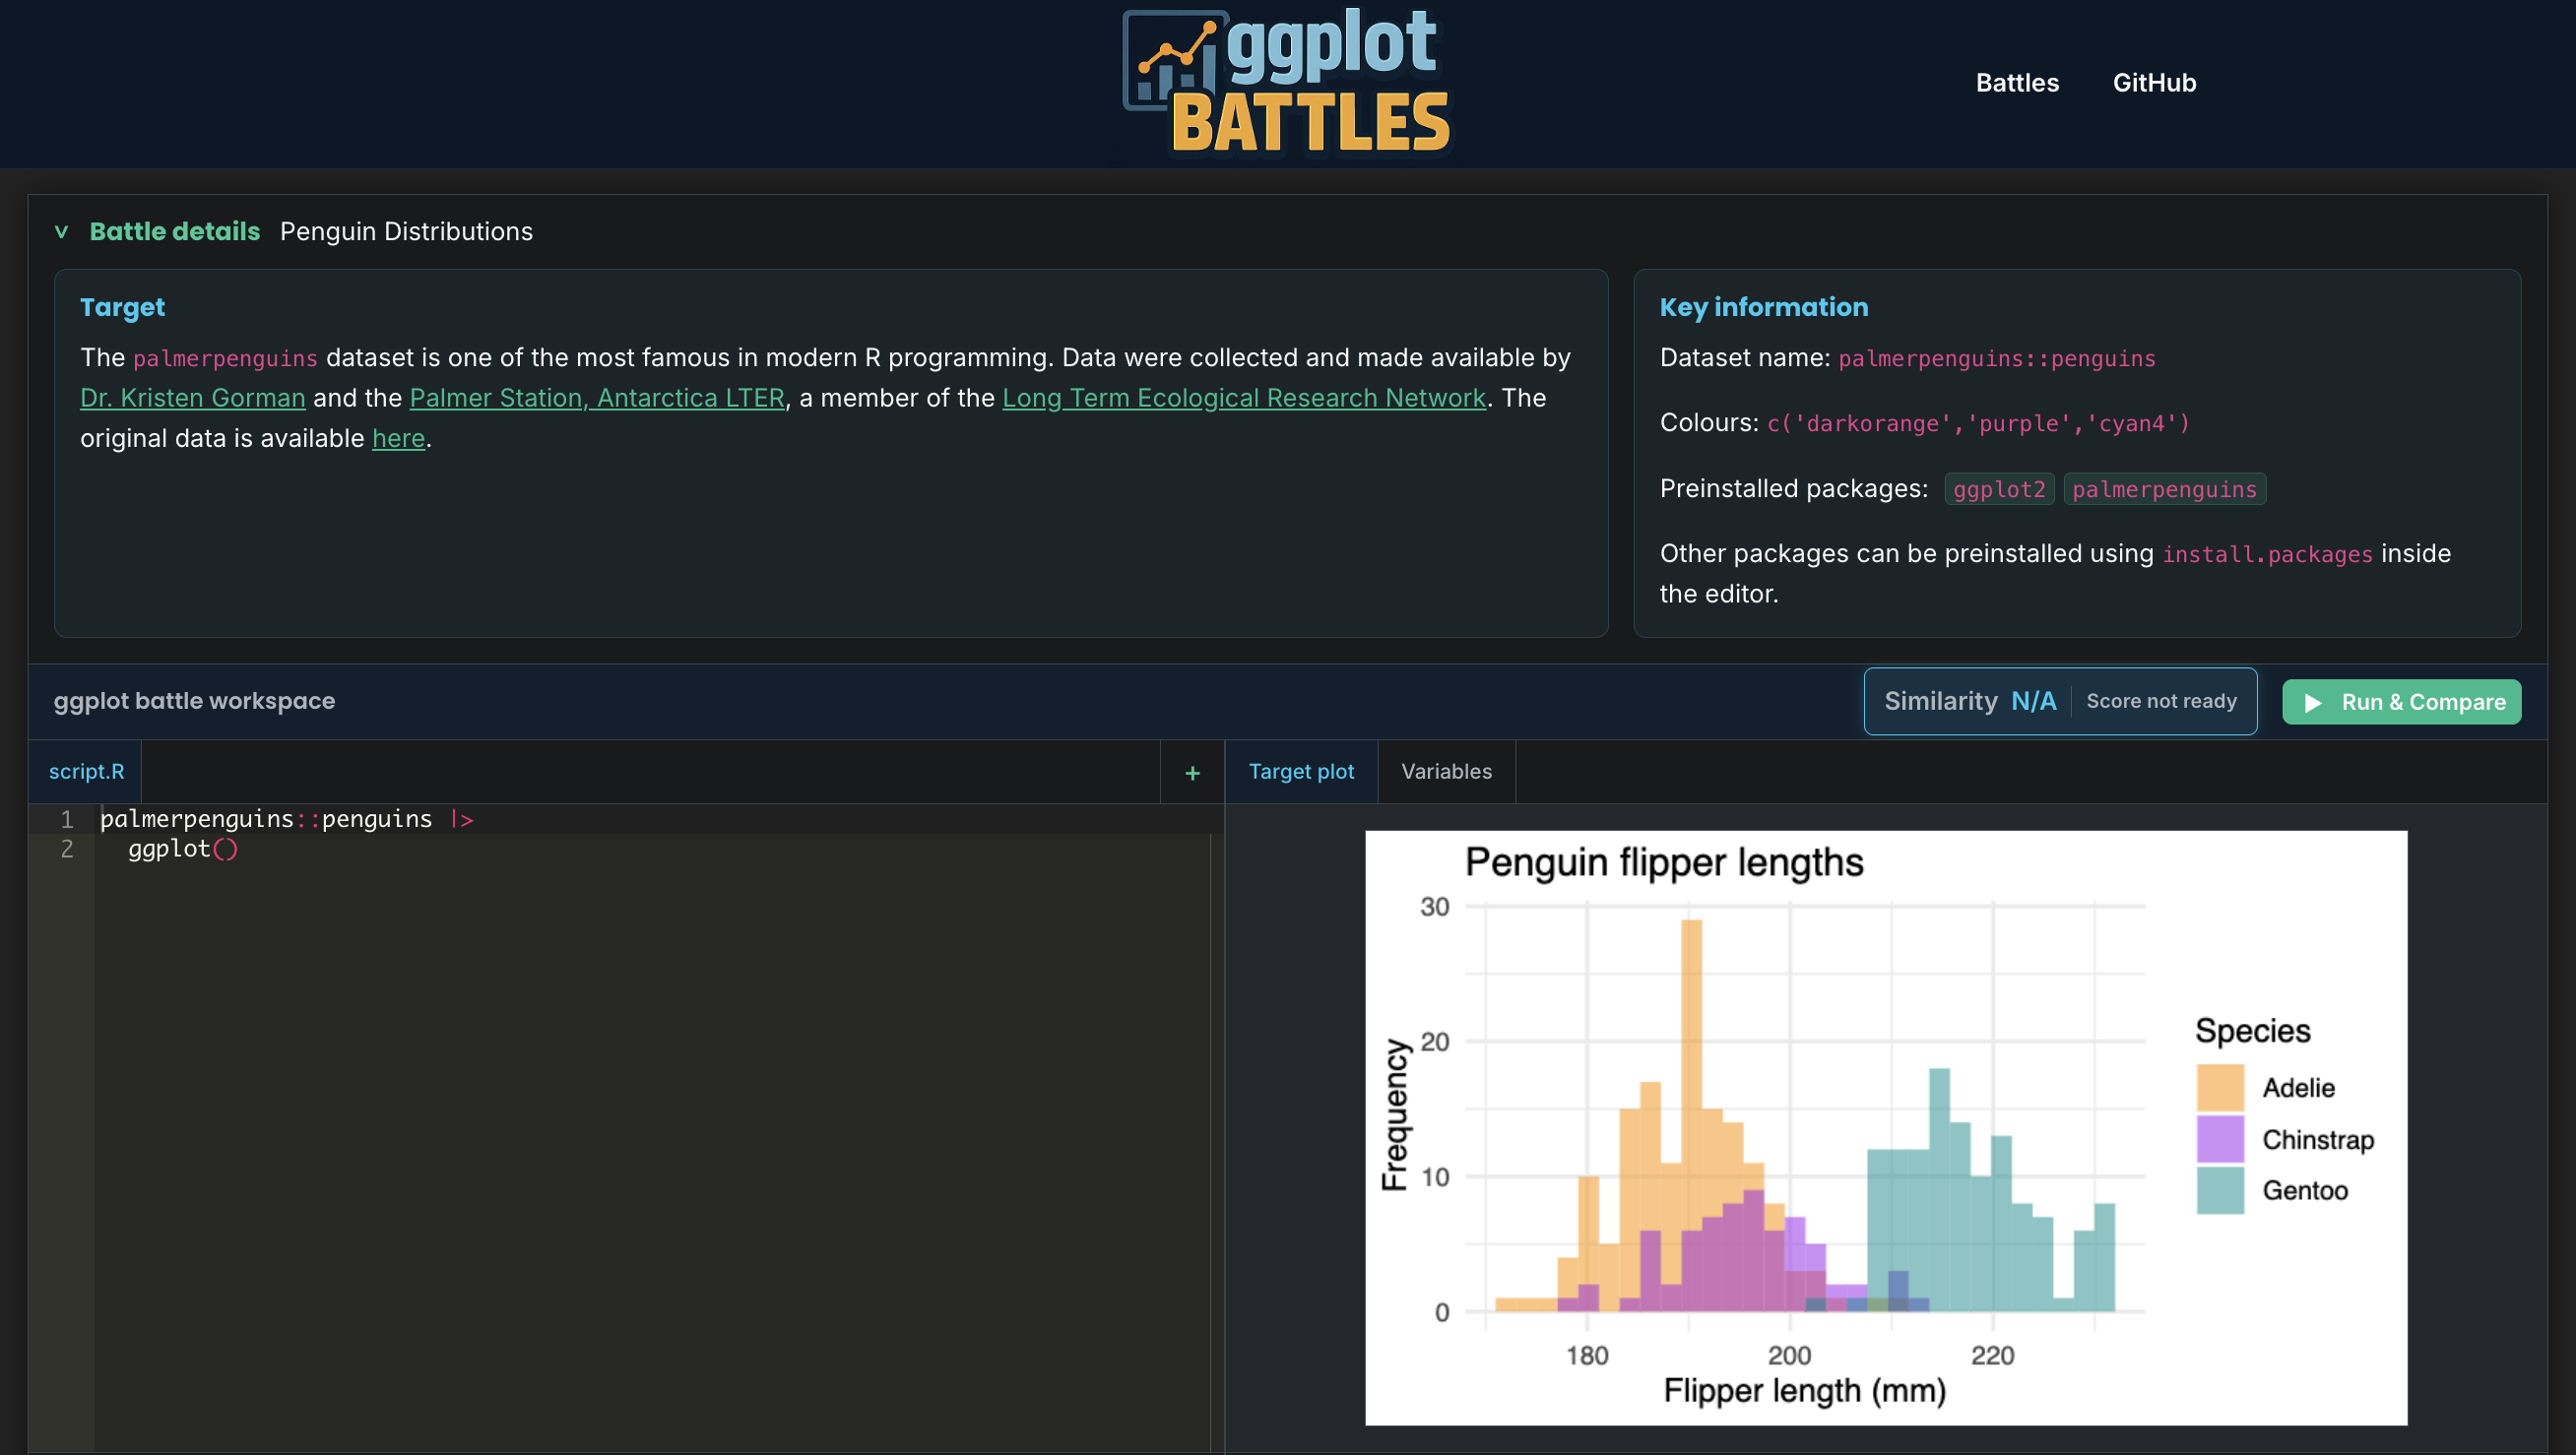
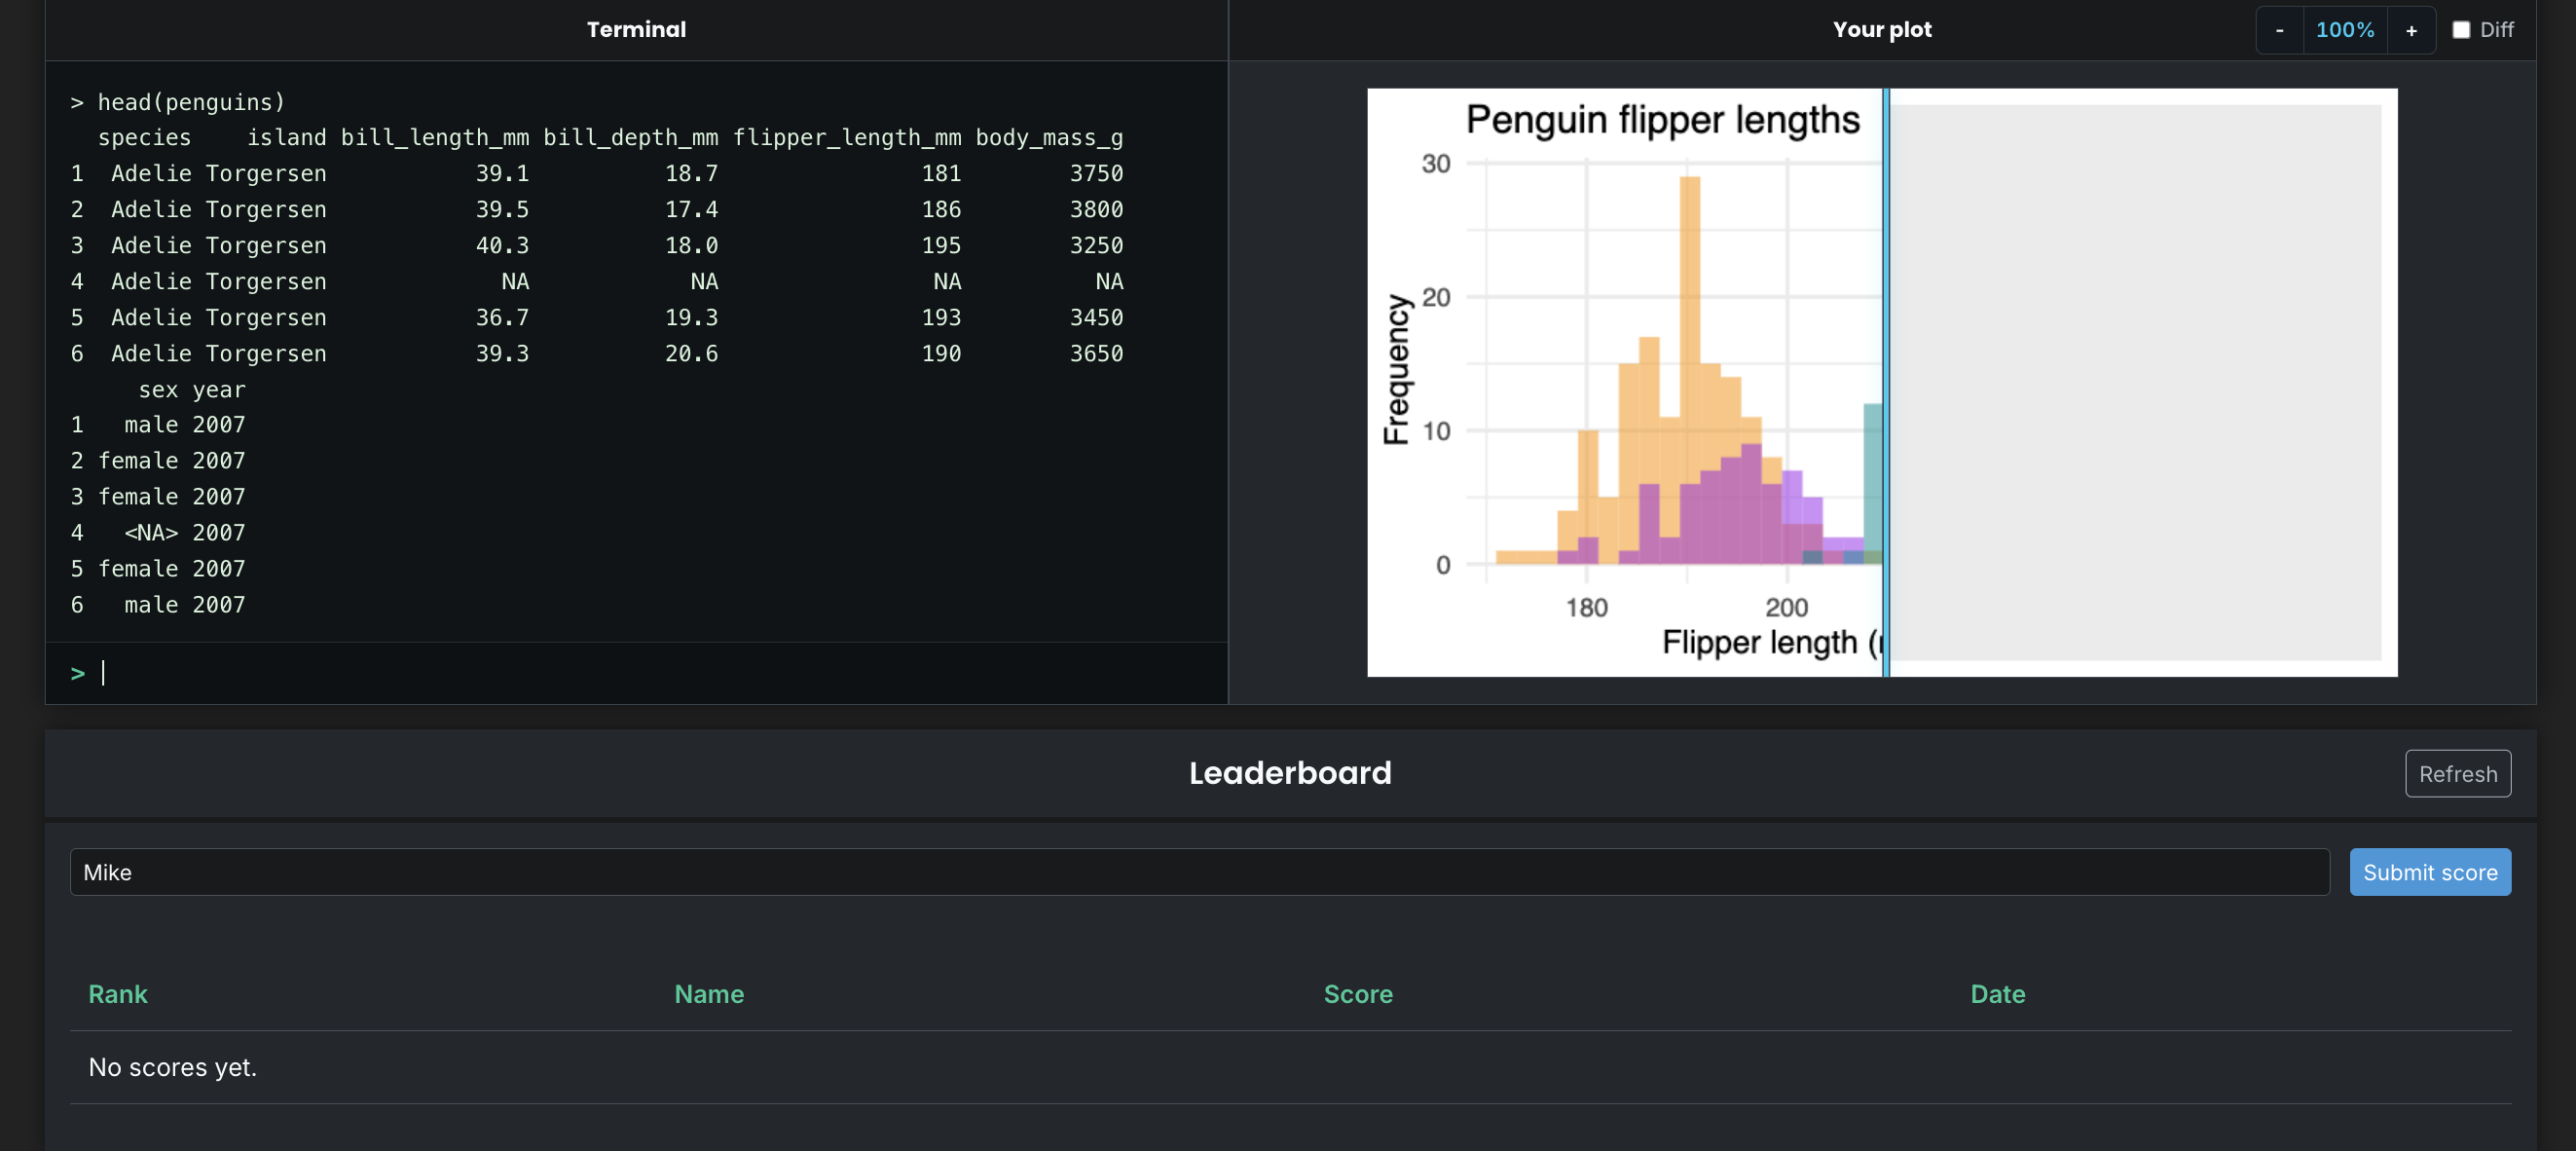
  • students write ggplot2 code in the browser
  • a target plot stays visible
  • their output is scored visually
  • repeated attempts are expected

ggplotbattles.dev

What students see

What students see
Under the hood

๐Ÿ“„๐Ÿคบ

Battle file R plus quarto-like metadata

๐ŸŒ

Browser R webR runs code without local setup

๐Ÿ–ผ๏ธ

Render target and attempt become images

๐Ÿ”

Compare pixel-by-pixel similarity

๐Ÿ”

Revise students iterate in place

A battle is just a file

#| title: "Penguin Distributions"
#| dataset-name: "palmerpenguins::penguins"
#| colours: "`c('darkorange', 'purple', 'cyan4')`"
#| description: "Recreate the target plot using the data provided."
library(ggplot2)
library(dplyr)
ggplot(penguins, aes(x = bill_length_mm, fill = species)) +
  geom_density(alpha = 0.6) +
  scale_fill_manual(values = c("darkorange", "purple", "cyan4"))

The study

134 consenting students in the class list

92 / 42 undergraduate / postgraduate

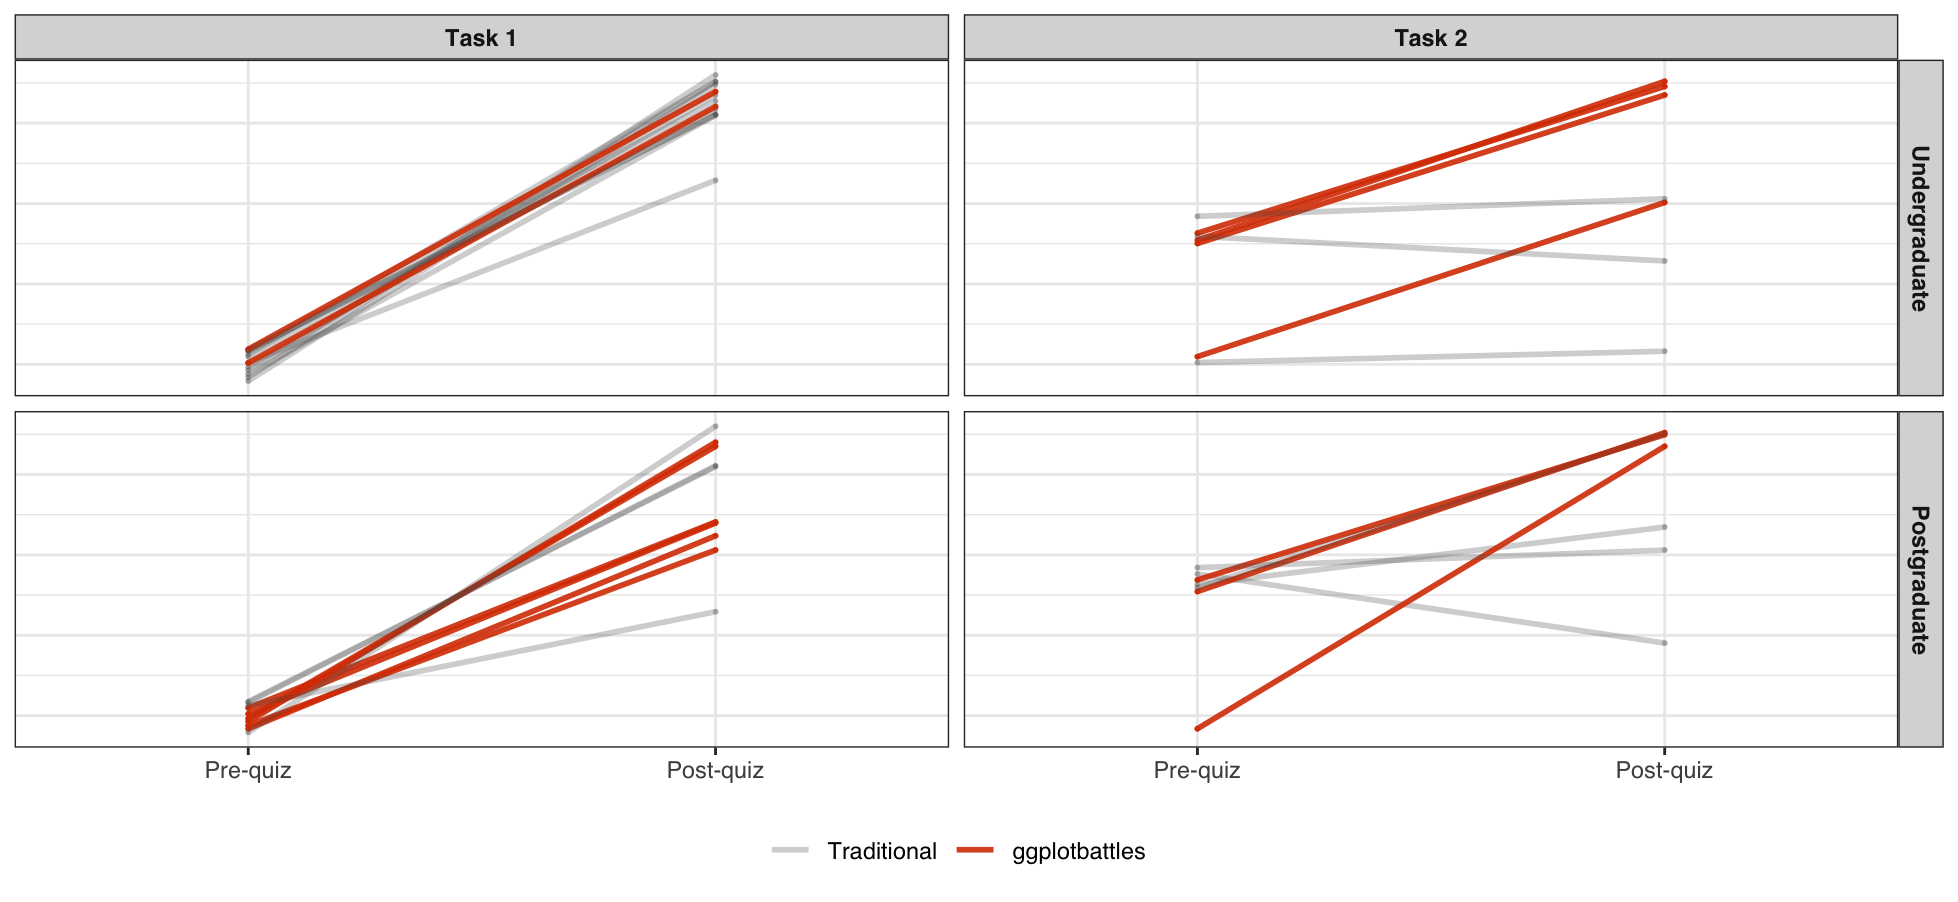
2 mini-tasks with pre/post quizzes


ETC1010/ETC5510 Introduction to Data Analysis, Monash University.

Experimental structure

Tutorial activity

  • tutorial groups allocated to a version
  • one version used ggplotbattles
  • the other used a traditional activity
  • allocation alternated across the two tasks

Measurement

  • pre-quiz before the activity
  • post-quiz after the activity
  • scores scaled from 0 to 1
  • outcome: post minus pre

The two tasks

Task 1

Introductory ggplot2 concepts:

  • bar charts
  • grouped summaries
  • column geometry
  • faceting

Task 2

More connected visualisation choices:

  • factor ordering
  • flipped coordinates
  • tile geometry
  • fixed coordinates
  • continuous colour scale

The prequiz was too easy

79% mean pre-quiz score, Task 1

94% mean pre-quiz score, Task 2

37 task attempts with room to improve


The full-sample analysis mostly measures what the quiz could detect.

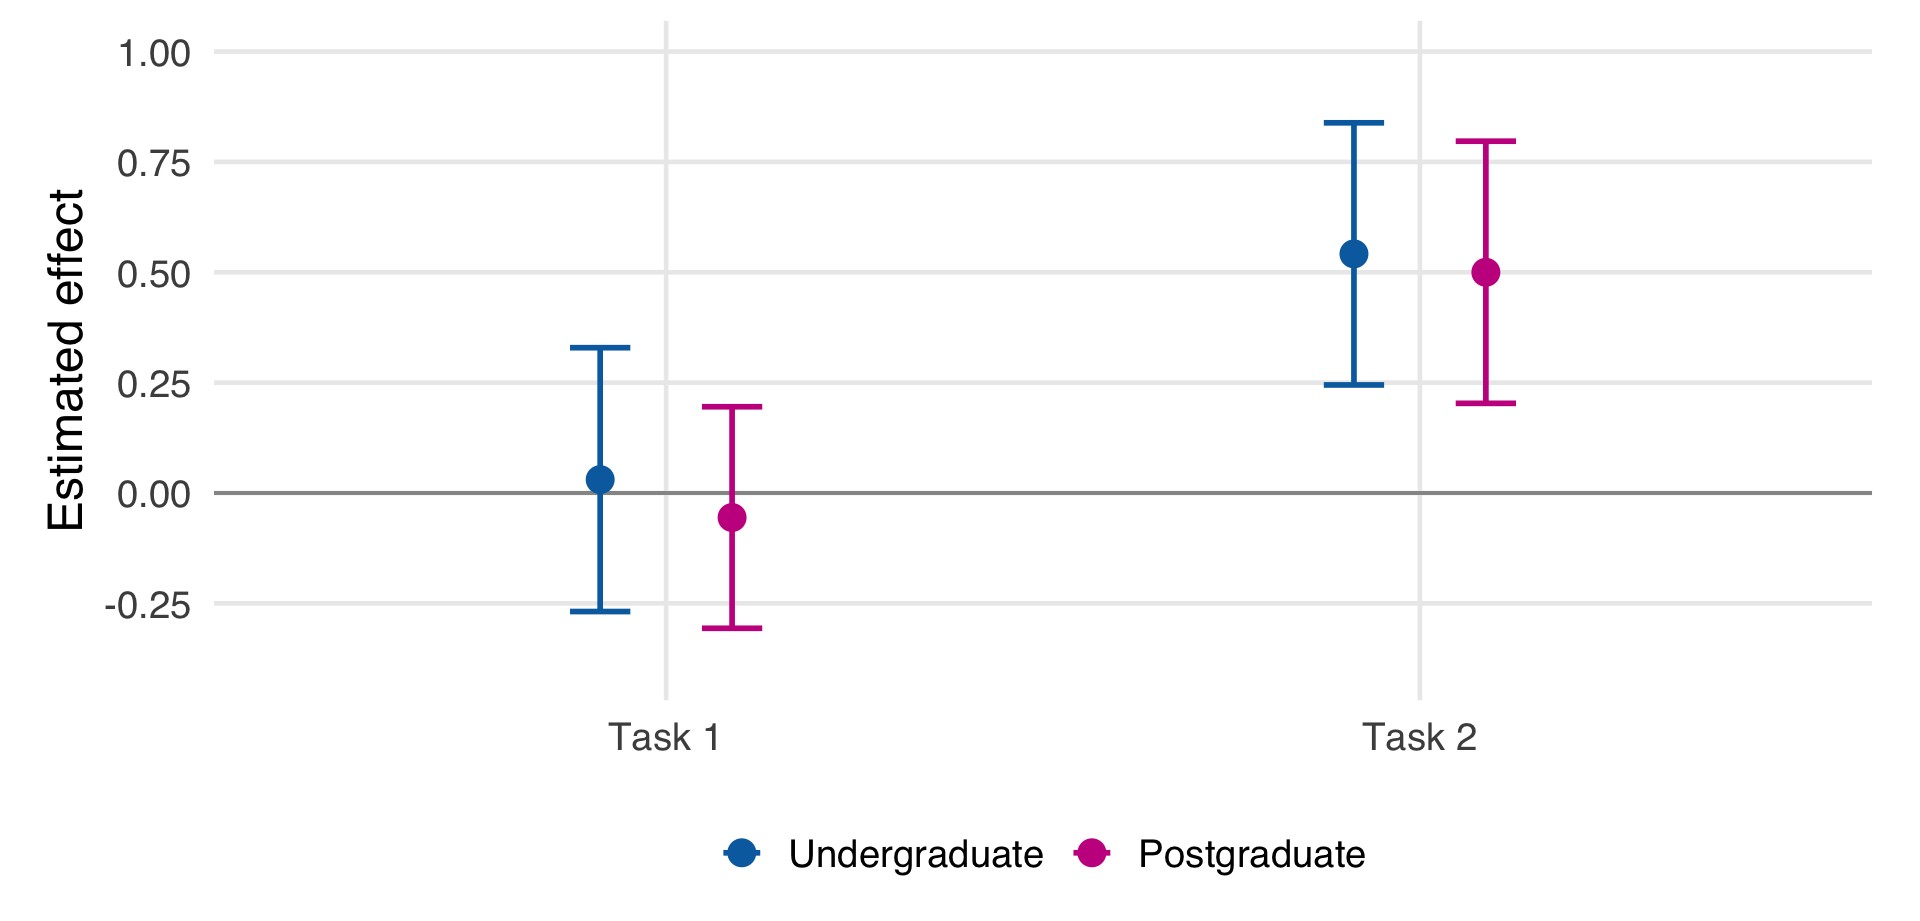
What changed for students with room to improve?
Estimated ggplotbattles effect
The interpretation

ggplotbattles seems most useful when the task requires several connected ggplot2 decisions.


That is the setting where immediate visual feedback can help students:

  • test a hypothesis about code
  • compare output against intent
  • revise without waiting for a tutor
  • learn from nearby attempts

What I would change next time

  • use harder and more discriminating pre-quiz items
  • add open-ended plotting tasks
  • use trace data from battle attempts
  • assess delayed retention
  • balance tutorial allocation more tightly

Where the system goes next

Teaching use

  • build battles aligned to weekly learning goals
  • use them as formative tutorial activities
  • let tutors discuss common wrong turns

Development

  • More battles
  • Improved scoring system reducing false positives
  • More choices around dataset and styling choies

Takeaway

Students learn data visualisation by making code choices, seeing the visual consequences, and trying again.


ggplotbattles gives that loop a classroom shape.


ggplotbattles.dev